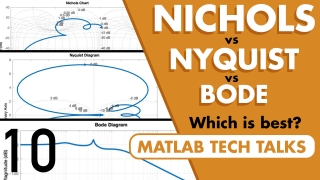
Explore three popular methods to visualize the frequency response of a linear time-invariant (LTI) system: the Nichols chart, the Nyquist plot, and the Bode plot. Learn about each method, including their strengths and weaknesses, and why you may choose one over another.
Find out how each plot presents the gain and phase shift of an LTI system across frequency, and discover how the different ways to present the information can help with system identification and closed-loop controller design.


