Intermediate
Article / Blog
Demonstration
Link to External Site
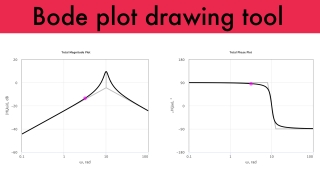
This page demonstrates the techniques described previously to take a transfer function defined by the user, identify the constituent terms, draw the individual Bode plots, and then combine them to obtain the overall transfer function of the transfer function. Finally, an example is given of how to use the Bode plot to find the time domain response of the system to a sinusoidal input.
Radioactivity
60
